Donchian Channel vs Bollinger Bands: Which Indicator Is Better?
Choosing the right technical indicator can make or break your trading success. Two popular tools—Donchian Channel and Bollinger Bands—help traders identify volatility, trends, and entry/exit points. But how do they differ? And which one should you use?
This guide breaks down the key differences between Donchian Channels and Bollinger Bands to help you make the best choice for your strategy.
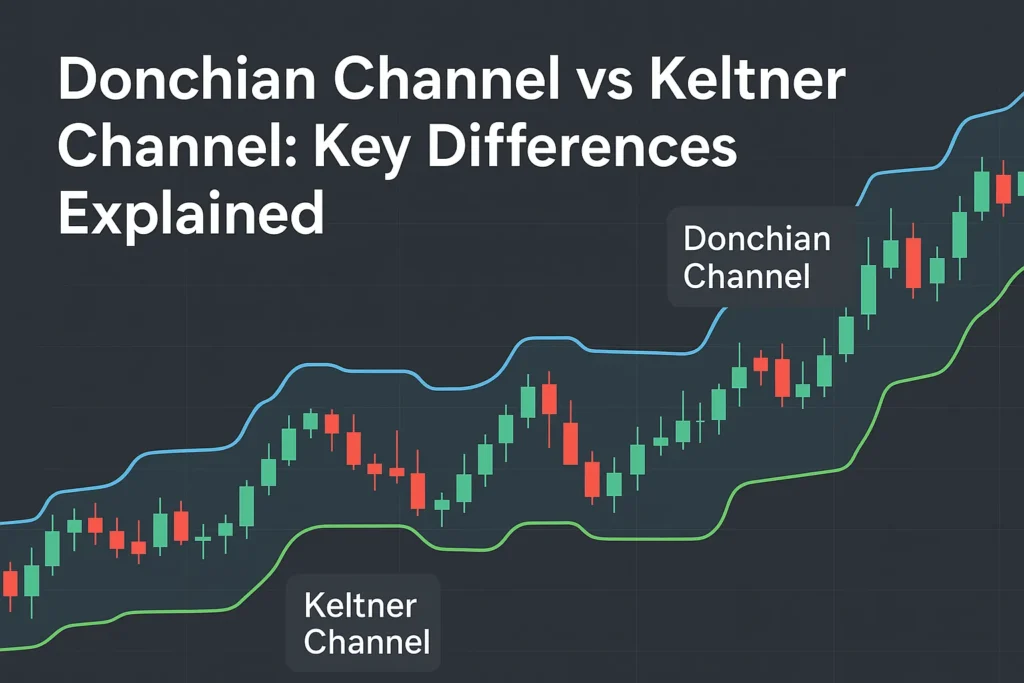
What Is the Donchian Channel?
The Donchian Channel plots the highest high and lowest low over a specific period, usually 20 days.
- Upper Band = highest high over the last n periods
- Lower Band = lowest low over the last n periods
- Middle Band = average of the upper and lower bands
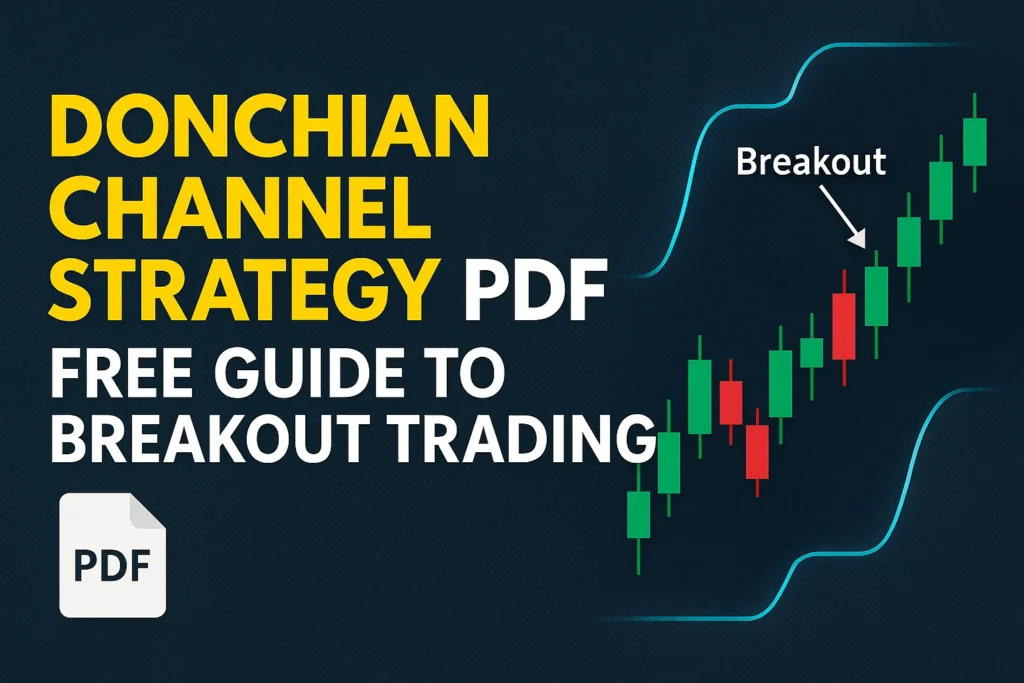
Use Case: Ideal for breakout and trend-following strategies.
What Are Bollinger Bands?
Bollinger Bands use a moving average and standard deviations to form a price envelope.
- Middle Band = simple moving average (typically 20-period)
- Upper/Lower Bands = ±2 standard deviations from the MA
Use Case: Better suited for identifying overbought/oversold conditions and volatility squeezes.
Key Differences: Donchian vs Bollinger
| Feature | Donchian Channel | Bollinger Bands |
|---|---|---|
| Basis | Highest High & Lowest Low | Moving Average + Standard Deviation |
| Volatility Measure | Range-based | Standard deviation |
| Signal Type | Breakout-based | Mean reversion and volatility-based |
| Trend Confirmation | Strong for trend-following | Moderate, better for reversals |
| Ease of Use | Very simple | Slightly more complex |
Which One Should You Use?
Use Donchian Channel if:
- You want to trade breakouts
- You prefer clear trend-following rules
- You want to minimize complexity
Use Bollinger Bands if:
- You trade mean reversion strategies
- You want to measure volatility expansion/contraction
- You look for price extremes around a moving average
Can You Combine Both?
Yes! Some traders use Bollinger Bands for volatility analysis and Donchian Channels for breakout confirmation. For example:
- Look for a Bollinger Band squeeze (low volatility),
- Then use a Donchian Channel breakout as the entry signal.
Chart Comparison Example
On a BTC/USD chart:
- Donchian Channel will highlight the breakout above the 20-day high.
- Bollinger Bands may show a price push beyond the upper band (possibly signaling overbought).
Both tell a story—but in different ways.
Conclusion
Both Donchian Channels and Bollinger Bands are powerful tools. The right choice depends on your trading style:
- Choose Donchian Channels for clarity and trend-following simplicity
- Choose Bollinger Bands for reversal trades and volatility-based setups
You don’t have to pick just one—try them together and see what works best for your system.
FAQs
Q1: Which is more beginner-friendly?
Donchian Channels are simpler and easier to understand.
Q2: Can I use them on the same chart?
Yes, combining both can give better context and signal quality.
Q3: Do both work on all timeframes?
Yes. They are flexible for day trading, swing trading, and even long-term investing.
Q4: Are Bollinger Bands better for crypto?
Not necessarily. Both work well in crypto if used with the right strategy.
Q5: Is there a strategy that uses both?
Yes. For example, you can wait for a Bollinger squeeze and enter on a Donchian breakout.