he Donchian Channel is a simple but powerful trading indicator that helps traders identify breakouts and follow trends. Created by Richard Donchian, a pioneer of trend-following systems, this tool has stood the test of time.
If you’re a beginner looking to understand how the Donchian Channel works and how to use it in your trading strategy, this guide will walk you through the basics step by step.
What Is the Donchian Channel?
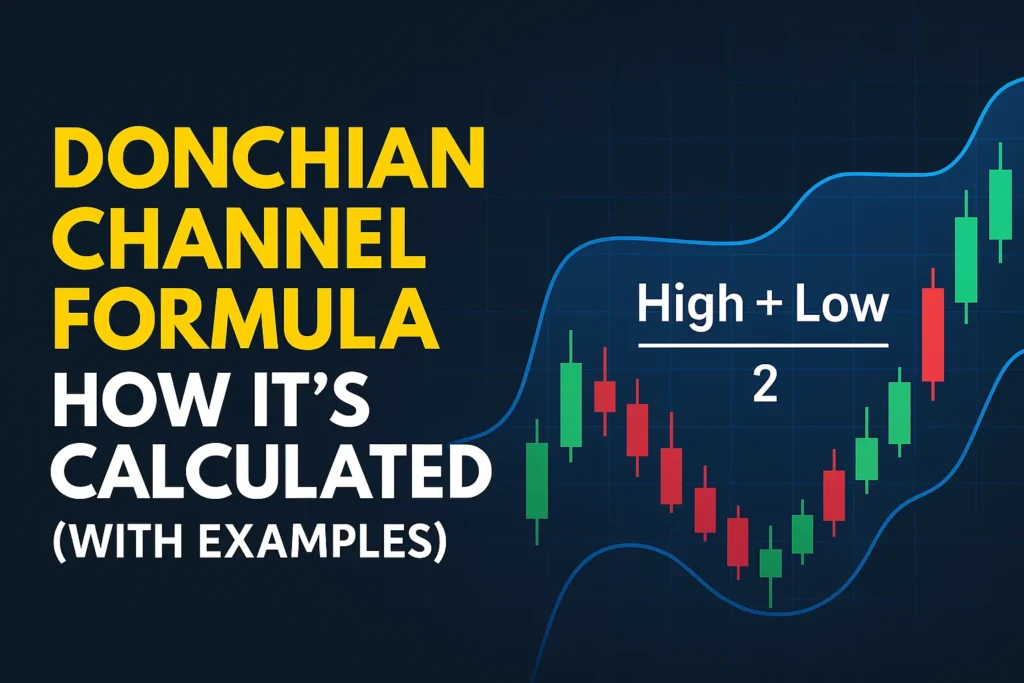
The Donchian Channel plots the highest high and lowest low over a specified period—usually 20 days. This creates three lines:
- Upper Band: The highest price over the last N periods
- Lower Band: The lowest price over the last N periods
- Middle Line: The average of the upper and lower bands
By displaying the range of recent prices, the channel helps traders spot breakouts and trend reversals.
Why Use the Donchian Channel?
1. Breakout Detection
When price breaks above the upper band, it may indicate a bullish breakout. A drop below the lower band may signal a bearish trend.
2. Trend Following
Donchian Channels are commonly used in trend-following systems. Traders enter positions when price moves beyond the channel and stay in the trade until the trend weakens.
3. Volatility Visualization
The width of the channel reflects market volatility. A wide channel means higher volatility; a narrow channel shows consolidation.
How to Read Donchian Channel Signals
- Buy Signal: Price closes above the upper band
- Sell Signal: Price closes below the lower band
- Exit Signal: Price closes back inside the channel
Traders often use additional indicators like volume or RSI for confirmation.
How to Set Up the Donchian Channel
Most platforms like TradingView, MetaTrader 4, and Thinkorswim offer Donchian Channels as a built-in indicator.
Steps:
- Search for “Donchian Channel” in the indicator list
- Choose your period (20 is a common starting point)
- Apply to the chart and observe the bands
Pros and Cons of the Donchian Channel
Pros:
- Easy to use
- Great for trend trading
- Works on all timeframes
Cons:
- Generates false signals in sideways markets
- Requires confirmation to avoid whipsaws
Donchian Channel Example
Suppose stock XYZ is trading within a tight range. Suddenly, it breaks above the 20-day high. This breakout, shown by the upper band, may be an early sign of a new trend. A trader can enter long and use the lower band as a stop-loss.
Conclusion
The Donchian Channel is a beginner-friendly indicator that highlights breakout opportunities and helps traders follow market trends. While it’s not a one-size-fits-all solution, combining it with proper risk management and confirmation tools can make it a powerful addition to your trading toolkit.
FAQs
Q1: What is the Donchian Channel used for?
It helps identify breakouts and trends based on recent highs and lows.
Q2: What is the default period for Donchian Channel?
Typically 20 days, but it can be customized.
Q3: Does the Donchian Channel work in forex and crypto?
Yes, it’s used across all markets including forex, crypto, stocks, and futures.
Q4: How do I reduce false signals from Donchian Channels?
Use confirmation indicators like RSI or volume, and avoid low-volatility environments.
Q5: Can I use Donchian Channel for day trading?
Yes, it works well on intraday charts like 15-min, 1-hour, or 4-hour timeframes.