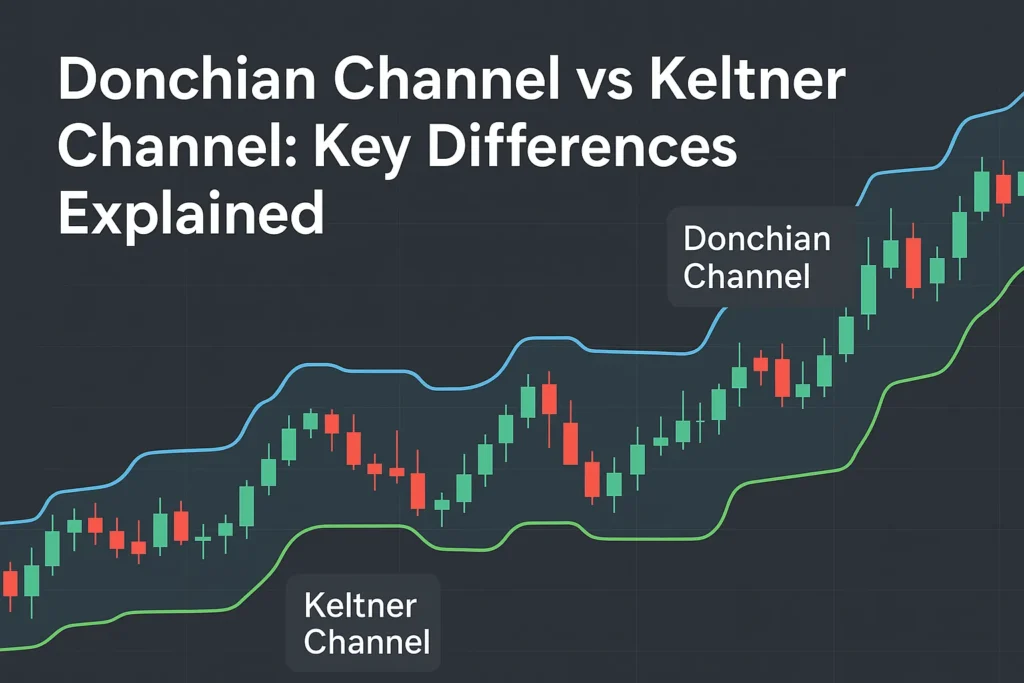
While the Donchian Channel is excellent for spotting breakouts, it can sometimes produce false signals—especially in volatile or ranging markets. That’s where the Relative Strength Index (RSI) comes in. When combined, these two indicators can help you avoid traps and make more accurate trading decisions.
In this guide, you’ll learn how to combine Donchian Channel with RSI, when to enter trades, and how to filter out weak signals.
Why Combine Donchian Channel and RSI?
- ✅ Donchian identifies price breakouts and trends
- ✅ RSI measures momentum and overbought/oversold conditions
Together, they help you confirm whether a breakout is likely to succeed or fail.
Indicator Overview
🔹 Donchian Channel:
- Breakout-based
- Focuses on price closing outside a recent high/low range
- Great for trend-following entries
🔹 RSI (Relative Strength Index):
- Momentum-based
- Values between 0–100
- Above 70 = overbought, below 30 = oversold
- Good for spotting reversals and momentum exhaustion
How to Use the Combo Strategy
Buy Setup:
- Price closes above the upper Donchian band (20-period)
- RSI is between 50–70 (confirming bullish momentum, but not overbought)
- Enter long on next candle
- Stop-loss = lower Donchian band or recent swing low
Sell Setup:
- Price closes below the lower Donchian band
- RSI is between 30–50 (confirming bearish momentum, but not oversold)
- Enter short
- Stop-loss = upper Donchian band or swing high
Why This Works
- ✅ Avoids buying in overbought conditions (RSI > 70)
- ✅ Confirms breakout momentum (RSI > 50 or < 50)
- ✅ Helps you filter weak or false signals during sideways markets
Example: Long Trade on BTC/USD
- Donchian Channel (20) shows a breakout above $30,000
- RSI = 62 → confirms momentum without being overbought
- Entry: $30,050
- Stop-loss: $28,800
- Exit: Target 2:1 or trail stop above lower band
✅ This trade aligns both trend and momentum indicators.
Tips for Optimization
- Use 4H or Daily charts for cleaner signals
- Avoid trading when RSI is near 70 or 30—wait for it to return within a tradeable range
- Combine with volume for an even stronger signal stack
- Backtest the combination on your preferred asset and timeframe
Platforms That Support Both
- TradingView (best for alerts and multi-indicator charting)
- MetaTrader 4/5 (with custom indicators if needed)
- Thinkorswim
- NinjaTrader
You can set up alerts based on Donchian + RSI cross conditions on platforms like TradingView.
Conclusion
Combining the Donchian Channel with RSI creates a powerful and flexible strategy that balances trend detection with momentum confirmation. By using both together, you can avoid poor entries, confirm true breakouts, and improve your overall trading success.
Test this approach on a demo account, fine-tune your settings, and start making smarter trading decisions.
FAQs
Q1: Can I use this combo for intraday trading?
Yes. Apply it on 15M, 1H, or 4H charts for intraday strategies.
Q2: What’s the best RSI level to confirm a Donchian breakout?
Between 50–70 for bullish, 30–50 for bearish setups.
Q3: Is this strategy beginner-friendly?
Yes. Both indicators are simple and visually easy to interpret.
Q4: What if RSI is above 70 during a breakout?
It may signal exhaustion—wait for a pullback or a second entry.
Q5: Do I need a paid platform to use both indicators?
No. Free accounts on TradingView or MT4 support both indicators.


